Framing The Question
A “green energy transition” typically means shifting electricity generation from coal, oil, and natural gas toward wind, solar, and batteries, with nuclear and hydro included or excluded depending on the advocate. Claims of lower costs, rapid emissions reductions, and improved energy security are common. So are claims of hidden system costs, reliability risks, and resource intensity. The only reliable way to evaluate these claims is with measured data: levelized costs, capacity factors, full-system requirements, lifecycle emissions, land use, material demands, and observed results from countries that have already moved farthest.
Brief Historical Context
Modern large-scale support for renewable energy grew out of 1960s–1970s environmental concerns and the oil shocks of that era. Germany’s feed-in tariff system (EEG) in the early 2000s accelerated deployment and drove down technology costs worldwide. From the 2000s onward, climate targets increasingly shaped policy, leading to subsidies, renewable portfolio standards, and net-zero commitments in many countries. These mechanisms produced rapid growth in wind and solar capacity. The empirical question today is what full costs and system performance have accompanied that growth.
Levelized Cost Of Energy Versus Full System Costs
Lazard’s LCOE+ analyses remain the most frequently cited plant-level comparison. In recent editions, unsubsidized utility-scale solar (large ground-mounted solar photovoltaic plants, typically greater than 1 MW, that deliver power to the transmission grid) and onshore wind often fall in roughly the $40–$100 per megawatt-hour (MWh — 1,000 kilowatt-hours) range, while new nuclear appears substantially higher and gas combined-cycle varies with fuel prices.
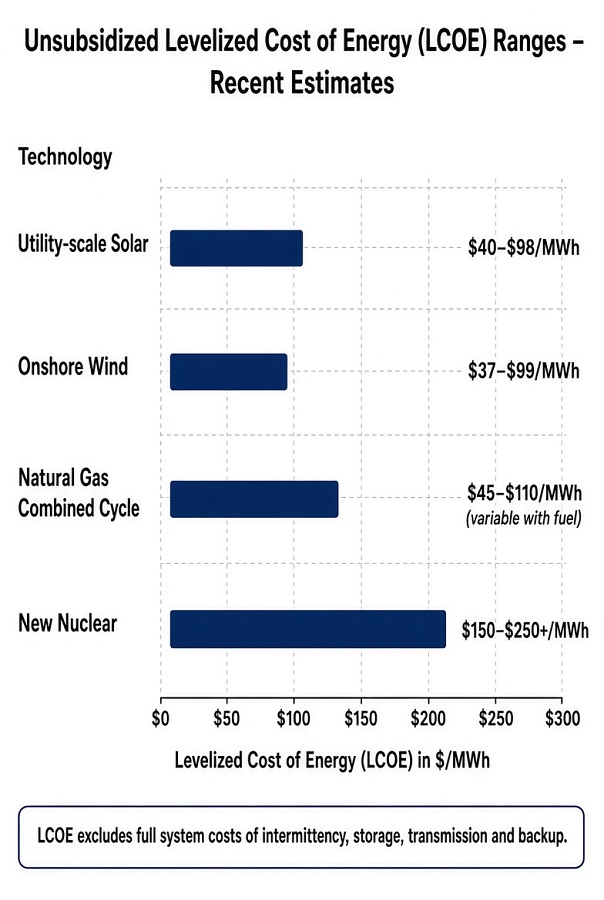
Unsubsidized LCOE ranges for utility-scale solar, onshore wind, natural gas combined cycle, and new nuclear. Simple plant-level LCOE does not include full system costs of intermittency, storage, transmission, or backup.
These figures measure the cost of building and operating a single plant under assumed capacity factors and financing. They do **not** include the costs of intermittency: backup generation, large-scale storage, expanded transmission, grid balancing services, and the need to maintain dispatchable capacity for periods when wind and solar output is low.
Studies that model full system costs at high renewable penetrations (the share of total electricity generation supplied by a given source) show a wide range of outcomes:
-
At moderate penetrations (under roughly 40–50 percent), integration costs are often modest and in some models can even reduce total system costs by displacing more expensive generation.
-
At high penetrations (80–100 percent), costs rise non-linearly. One major U.S. modeling effort found average system costs moving from a least-cost baseline near $30/MWh (around 57 percent renewables) to approximately $39/MWh at 100 percent renewables under base assumptions—an increase of about 30 percent. Sensitivity cases produced total system cost increases in the 21–50 percent range depending on technology cost trajectories, transmission availability, and how strictly the 100 percent target is defined.
-
Analyses that force near-firm (highly reliable) power primarily from wind, solar, and storage often show still larger premiums, especially when current battery costs and long-duration or seasonal storage needs are used. Optimistic assumptions about future storage cost declines and flexible demand narrow the gap; pessimistic assumptions widen it substantially.
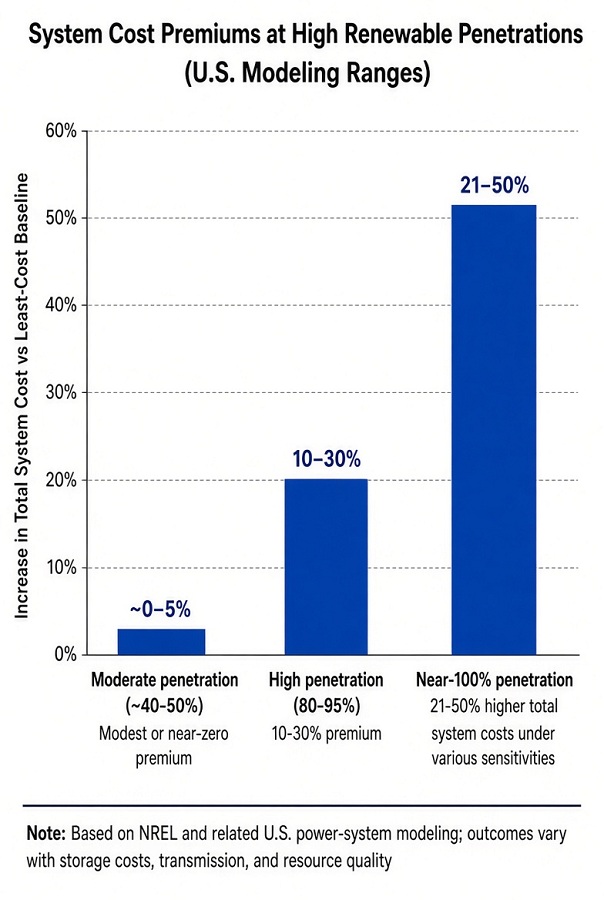
Approximate system cost premiums relative to a least-cost baseline at different renewable penetration levels. Premiums rise non-linearly and vary with storage costs, transmission, and resource quality.
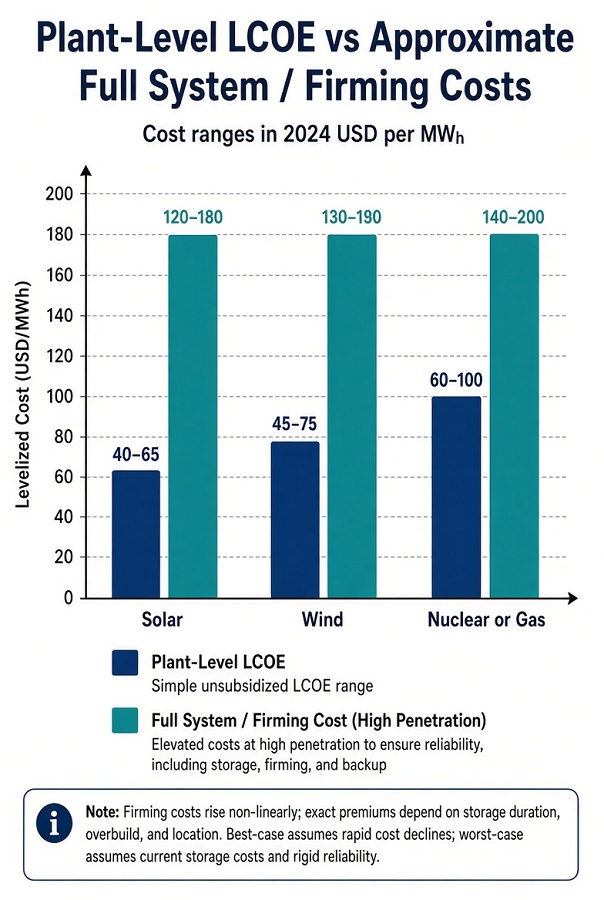
Comparison of simple plant-level LCOE ranges with approximate full system or firming costs at high penetration. The elevated ranges illustrate the additional cost of ensuring reliability through storage, overbuild, and backup.
In short, best-case system-cost outcomes assume continued rapid declines in storage and renewable costs, high-quality resources, strong transmission, and demand flexibility. Worst-case outcomes assume slower cost progress, poorer resources, rigid reliability requirements, and limited transmission. Treating simple LCOE as the complete cost of a high-renewable transition is therefore incomplete.
Capacity Factors And Actual Output
Nameplate capacity (the maximum rated electrical output of a generator under ideal conditions, expressed in megawatts or gigawatts) is not the same as energy delivered. Actual output is lower and is measured by the capacity factor. Recent U.S. data illustrate the difference:
-
Nuclear: approximately 92–93 percent
-
Natural gas combined-cycle: roughly 50–60 percent
-
Coal: around 40–42 percent
-
Wind: approximately 34 percent
-
Utility-scale solar: approximately 23 percent
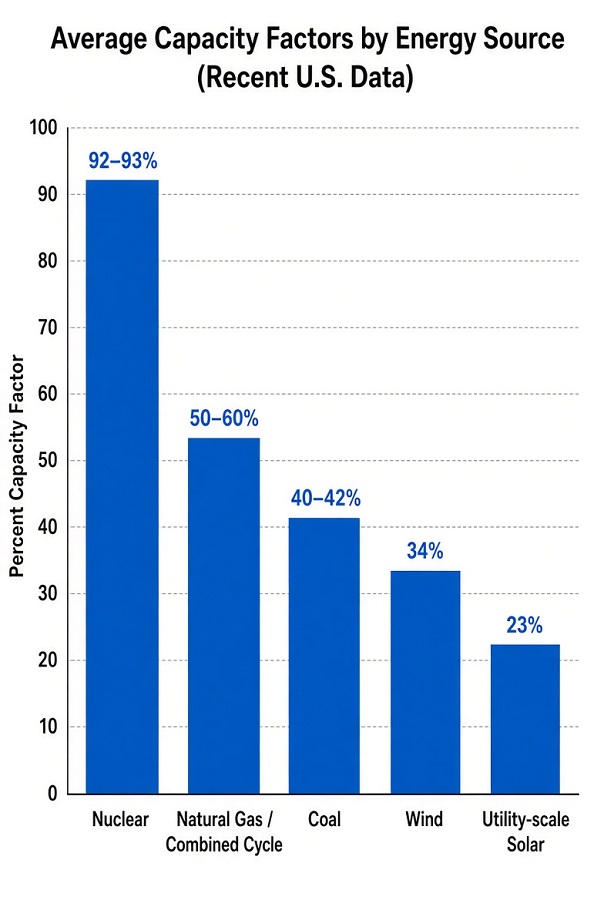
Recent U.S. average capacity factors by energy source. Lower capacity factors for wind and solar mean more nameplate capacity (and supporting infrastructure) is required to deliver the same energy as high-capacity-factor sources.
A wind or solar facility must be oversized, paired with storage, or backed by other generation to deliver the same reliable energy as a high-capacity-factor plant. This multiplies capital, land, and material requirements.
Lifecycle Greenhouse Gas Emissions
Lifecycle assessments that include construction, fuel, operation, and decommissioning produce the following approximate median ranges (grams of CO₂-equivalent per kilowatt-hour):
-
Coal: ~740–910 g
-
Natural gas: ~410–650 g
-
Solar PV: ~40–50 g
-
Wind: ~11–35 g
-
Nuclear: ~5–15 g
-
Hydro: generally low, though site-specific
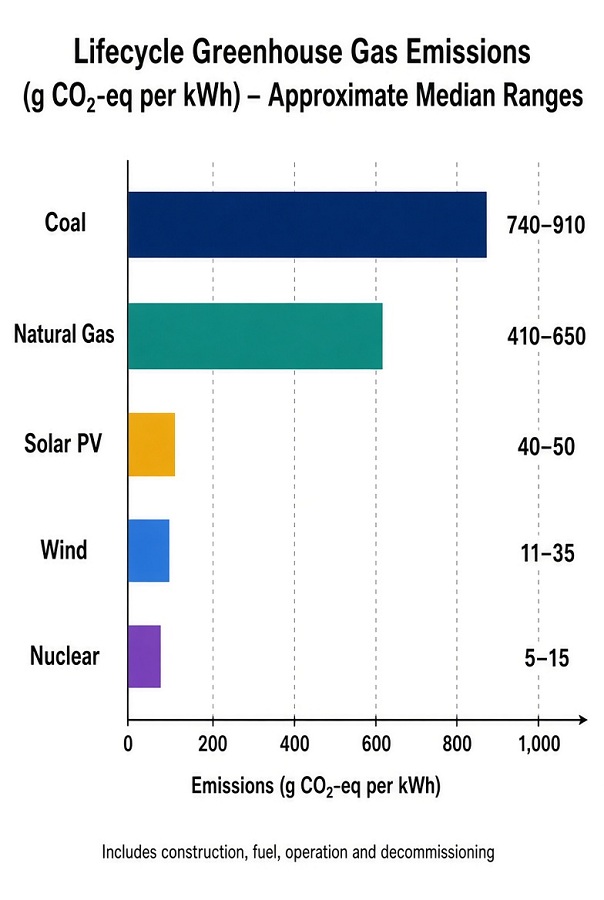
Approximate median lifecycle greenhouse gas emissions (g CO₂-eq per kWh). Wind, solar, and nuclear are all low-carbon relative to coal and natural gas on a full lifecycle basis.
Wind, solar, and nuclear are all low-carbon on a lifecycle basis compared with coal and gas. The magnitude of system-wide emissions reduction depends on how much firm, low-carbon capacity is displaced or retained and on the emissions intensity of the backup generation used during low renewable output.
Land Use And Energy Density
Land-use intensity studies show large differences when measured in hectares per terawatt-hour (TWh — 1 billion kilowatt-hours) per year. Nuclear typically requires the least land (median around 7 hectares per TWh per year). Natural gas and coal are also relatively compact.
Utility-scale solar requires substantially more land—on the order of 2,000 hectares per TWh per year for ground-mounted systems. Wind occupies a modest direct footprint (turbines and access roads, roughly 130 hectares per TWh per year) but a much larger spacing area across the full wind farm (around 12,000 hectares per TWh per year). Most of the spacing between turbines can remain available for agriculture or grazing.
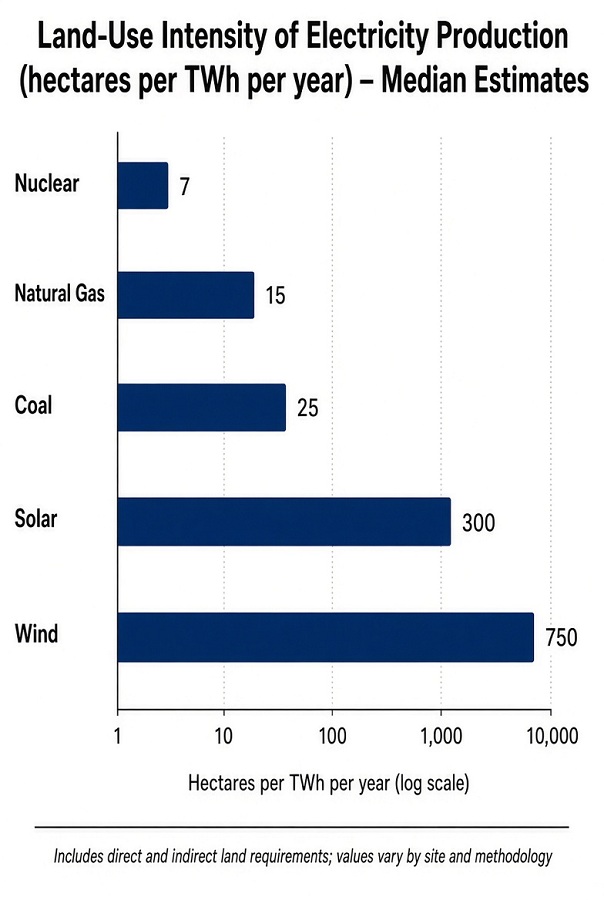
Land-use intensity (hectares per TWh per year). Nuclear has the lowest intensity. Wind shows a large difference between direct footprint and full spacing area; solar is significantly higher than nuclear or fossil sources on a total-land basis.
At national scale in the United States, current utility-scale solar occupies a very small fraction of total land (approximately 0.04 percent) and of farmland (approximately 0.07 percent). High-renewable scenarios that rely heavily on wind and solar would require far more land than nuclear- or gas-dominated systems. Direct footprints remain modest relative to the entire country, yet the conversion of open or agricultural land for solar and the extensive spacing of wind farms become material.
These differences affect food production, habitat, and visual impact. Solar development has often used flat, cleared agricultural land, creating competition with farming on prime soils; dual-use “agrivoltaic” designs can reduce the conflict but are not yet widespread. Wind farms can fragment habitat and cause bird and bat collisions. Large solar arrays alter local ecosystems. Visually, wind turbines are prominent over long distances and have generated local opposition and modest property-value effects in some studies; large solar installations change the appearance of open landscapes. Careful siting and dual-use approaches can mitigate but not eliminate these trade-offs.
Materials, Mining, And Supply Chains
Wind turbines, solar panels, and batteries are material-intensive relative to their energy output over time. Copper, rare earth elements, lithium, nickel, cobalt, steel, and concrete demands rise sharply with high renewable and storage deployment. Mining and processing of these materials carry their own environmental and geopolitical costs. Concentrated supply chains (particularly for processing) create strategic dependencies that differ from those of fossil fuels or uranium.
Observed Results: Germany’s Energiewende
Germany provides the longest large-scale test case. Cumulative support costs for the transition run into the hundreds of billions of euros. Residential electricity prices have remained among the highest in Europe. Industrial electricity prices have frequently been well above those in the United States and parts of Asia, contributing to competitiveness concerns. Emissions declined overall, yet the simultaneous phase-out of nuclear power required continued reliance on coal and gas during periods of low renewable output. Grid stability has been maintained, but at the price of extensive backup capacity, interconnectors, and ongoing subsidies.
Reliability And Dispatchability
Wind and solar are variable. High penetrations require either massive overbuilding plus storage, or retention of dispatchable plants (gas, coal, nuclear, hydro, or geothermal). Storage costs and durations remain limiting for multi-day or seasonal gaps. Systems that have pushed renewables farthest have experienced price volatility, negative pricing events, and occasional stress on reliability. Firm low-carbon sources (nuclear, hydro, geothermal) avoid this variability but face their own cost, siting, and political obstacles.
Synthesis Of Trade-Offs
Empirical patterns that emerge from the data:
-
Wind and solar have achieved low plant-level costs and low lifecycle emissions.
-
Their variability imposes system costs and capacity requirements that simple LCOE figures omit; these system costs rise non-linearly at high penetration and vary widely with assumptions about storage, transmission, and resource quality.
-
Nuclear offers high capacity factors, very low lifecycle emissions, and minimal land use, but high upfront capital costs and long construction times for new plants in the West.
-
Natural gas provides flexible, relatively lower-emission backup at moderate cost.
-
Rapid forced transitions that retire firm capacity faster than reliable low-carbon replacements are built raise prices and reliability risks, as seen in several jurisdictions.
The net benefit of any specific transition path depends on the starting generation mix, the speed of change, the inclusion or exclusion of nuclear and hydro, the cost trajectory of storage, and the value placed on emissions reductions versus energy affordability and reliability.
Primary Sources
-
Lazard Levelized Cost of Energy+ reports (recent editions)
-
U.S. Energy Information Administration capacity-factor and generation data
-
Lifecycle assessment summaries (IPCC, UNECE, and academic meta-analyses)
-
NREL and related U.S. power-system modeling of high renewable penetrations (including Joule/ScienceDirect studies)
-
Systematic reviews of variable renewable integration costs
-
Land-use intensity studies (Lovering et al. and related analyses)
-
German Federal Network Agency and electricity-price statistics; independent Energiewende cost analyses
Call To Action
Examine the primary sources directly. Compare plant-level LCOE claims against full-system modeling results and real-world price and reliability outcomes. Which metrics matter most for affordability, reliability, and emissions? Where do the largest uncertainties remain? Share data-driven assessments in the replies. Evidence over assertion.